- Published on
- • 7 min read
NodeLLM Monitor: Production Observability for LLM Applications
- Authors

- Name
- Shaiju Edakulangara
- @eshaiju
Building AI applications without observability is like flying blind. You ship a chatbot, usage spikes, and suddenly you're hit with a $500 OpenAI bill with no idea where it came from.
Why not just use Datadog, New Relic, or Langfuse?
Traditional APM tools weren't built for LLM workloads. They'll show you request latency, but not token costs. They'll log errors, but not prompt/response pairs. You end up paying $50+/month for generic metrics while building custom instrumentation for the AI-specific data you actually need.
@node-llm/monitor is different:
- AI-Native Metrics — Token usage, cost per request, prompt/response content, tool call traces—out of the box
- Zero External Dependencies — Embedded dashboard ships with the package. No SaaS vendor, no data leaving your infrastructure
- Open Source & Free — No per-seat pricing, no usage tiers, no surprise bills
- Self-Hosted — Your data stays in your database (Postgres, SQLite, or even in-memory)
- Framework Agnostic — Works with NodeLLM, Vercel AI SDK, LangChain, or raw OpenAI calls
@node-llm/monitor solves this problem at the infrastructure level.
The Problem: LLM Black Boxes
Every production LLM system eventually needs answers to:
- "Why is this request so slow?" — Was it the model? The prompt? A tool call?
- "Which feature is burning our budget?" — Is it the chatbot? The document search? The agent?
- "What happened to user X's session?" — Can we replay the conversation?
- "Are we hitting rate limits?" — How close are we to provider quotas?
Without proper monitoring, you're guessing. With @node-llm/monitor, you know.
Quick Start
Install and integrate in under 5 minutes:
npm install @node-llm/monitor
import { createLLM } from "@node-llm/core";
import { Monitor } from "@node-llm/monitor";

// Create monitor (defaults to in-memory)
const monitor = Monitor.memory();

// Add to your LLM instance - monitor IS the middleware
const llm = createLLM({
  provider: "openai",
  model: "gpt-4o-mini",
  openaiApiKey: process.env.OPENAI_API_KEY,
  middlewares: [monitor],
});
Every LLM call is now tracked. To visualize your data, jump to the Dashboard section below.
What Gets Captured
Every request automatically captures:
| Metric | Description |
|---|---|
| Provider | OpenAI, Anthropic, Google, etc. |
| Model | gpt-4o, claude-3-opus, gemini-pro |
| Latency | Total request time in milliseconds |
| Tokens | Input, output, and total token counts |
| Cost | Calculated cost based on provider pricing |
| Status | Success, error, timeout |
| Tool Calls | Function executions with timing |
Plus optional full request/response content for debugging.
The Dashboard
The built-in dashboard provides real-time visibility:
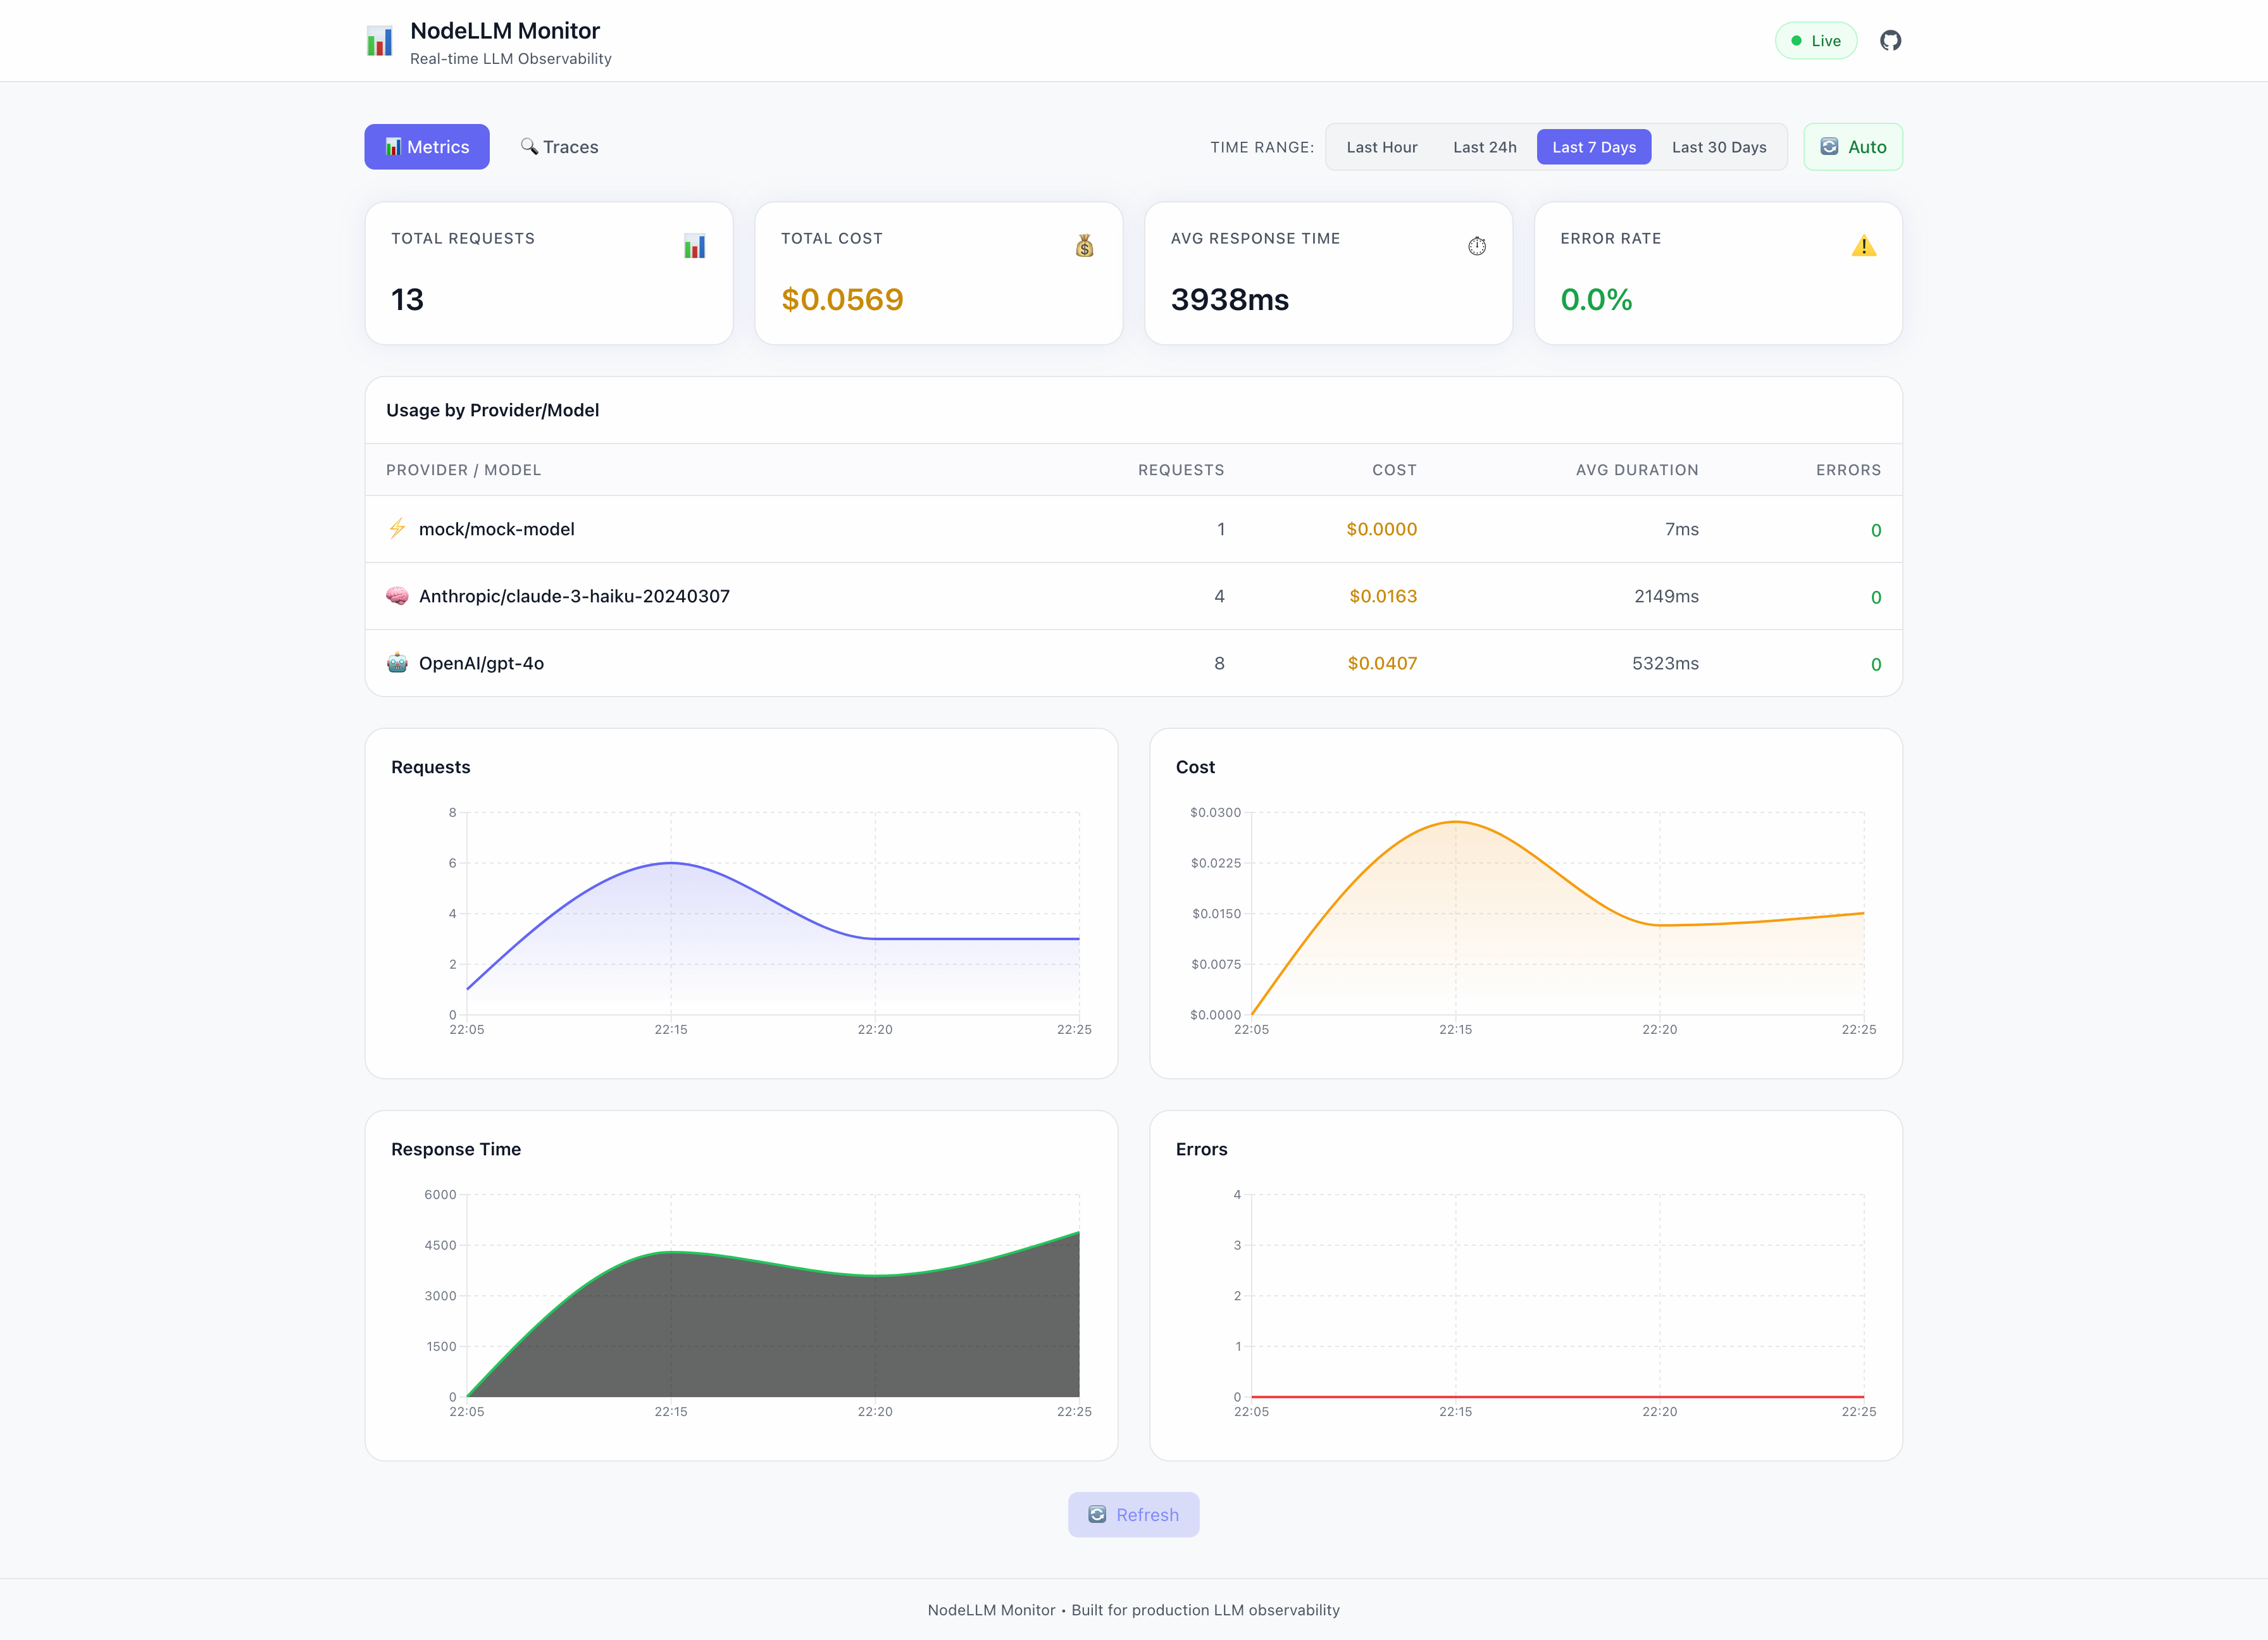
Metrics View
At a glance, see:
- Total Requests — Request volume over time
- Total Cost — Running cost accumulation
- Avg Response Time — P50/P90 latency
- Error Rate — Failure percentage
Plus interactive charts for requests, costs, response times, and errors.
Traces View
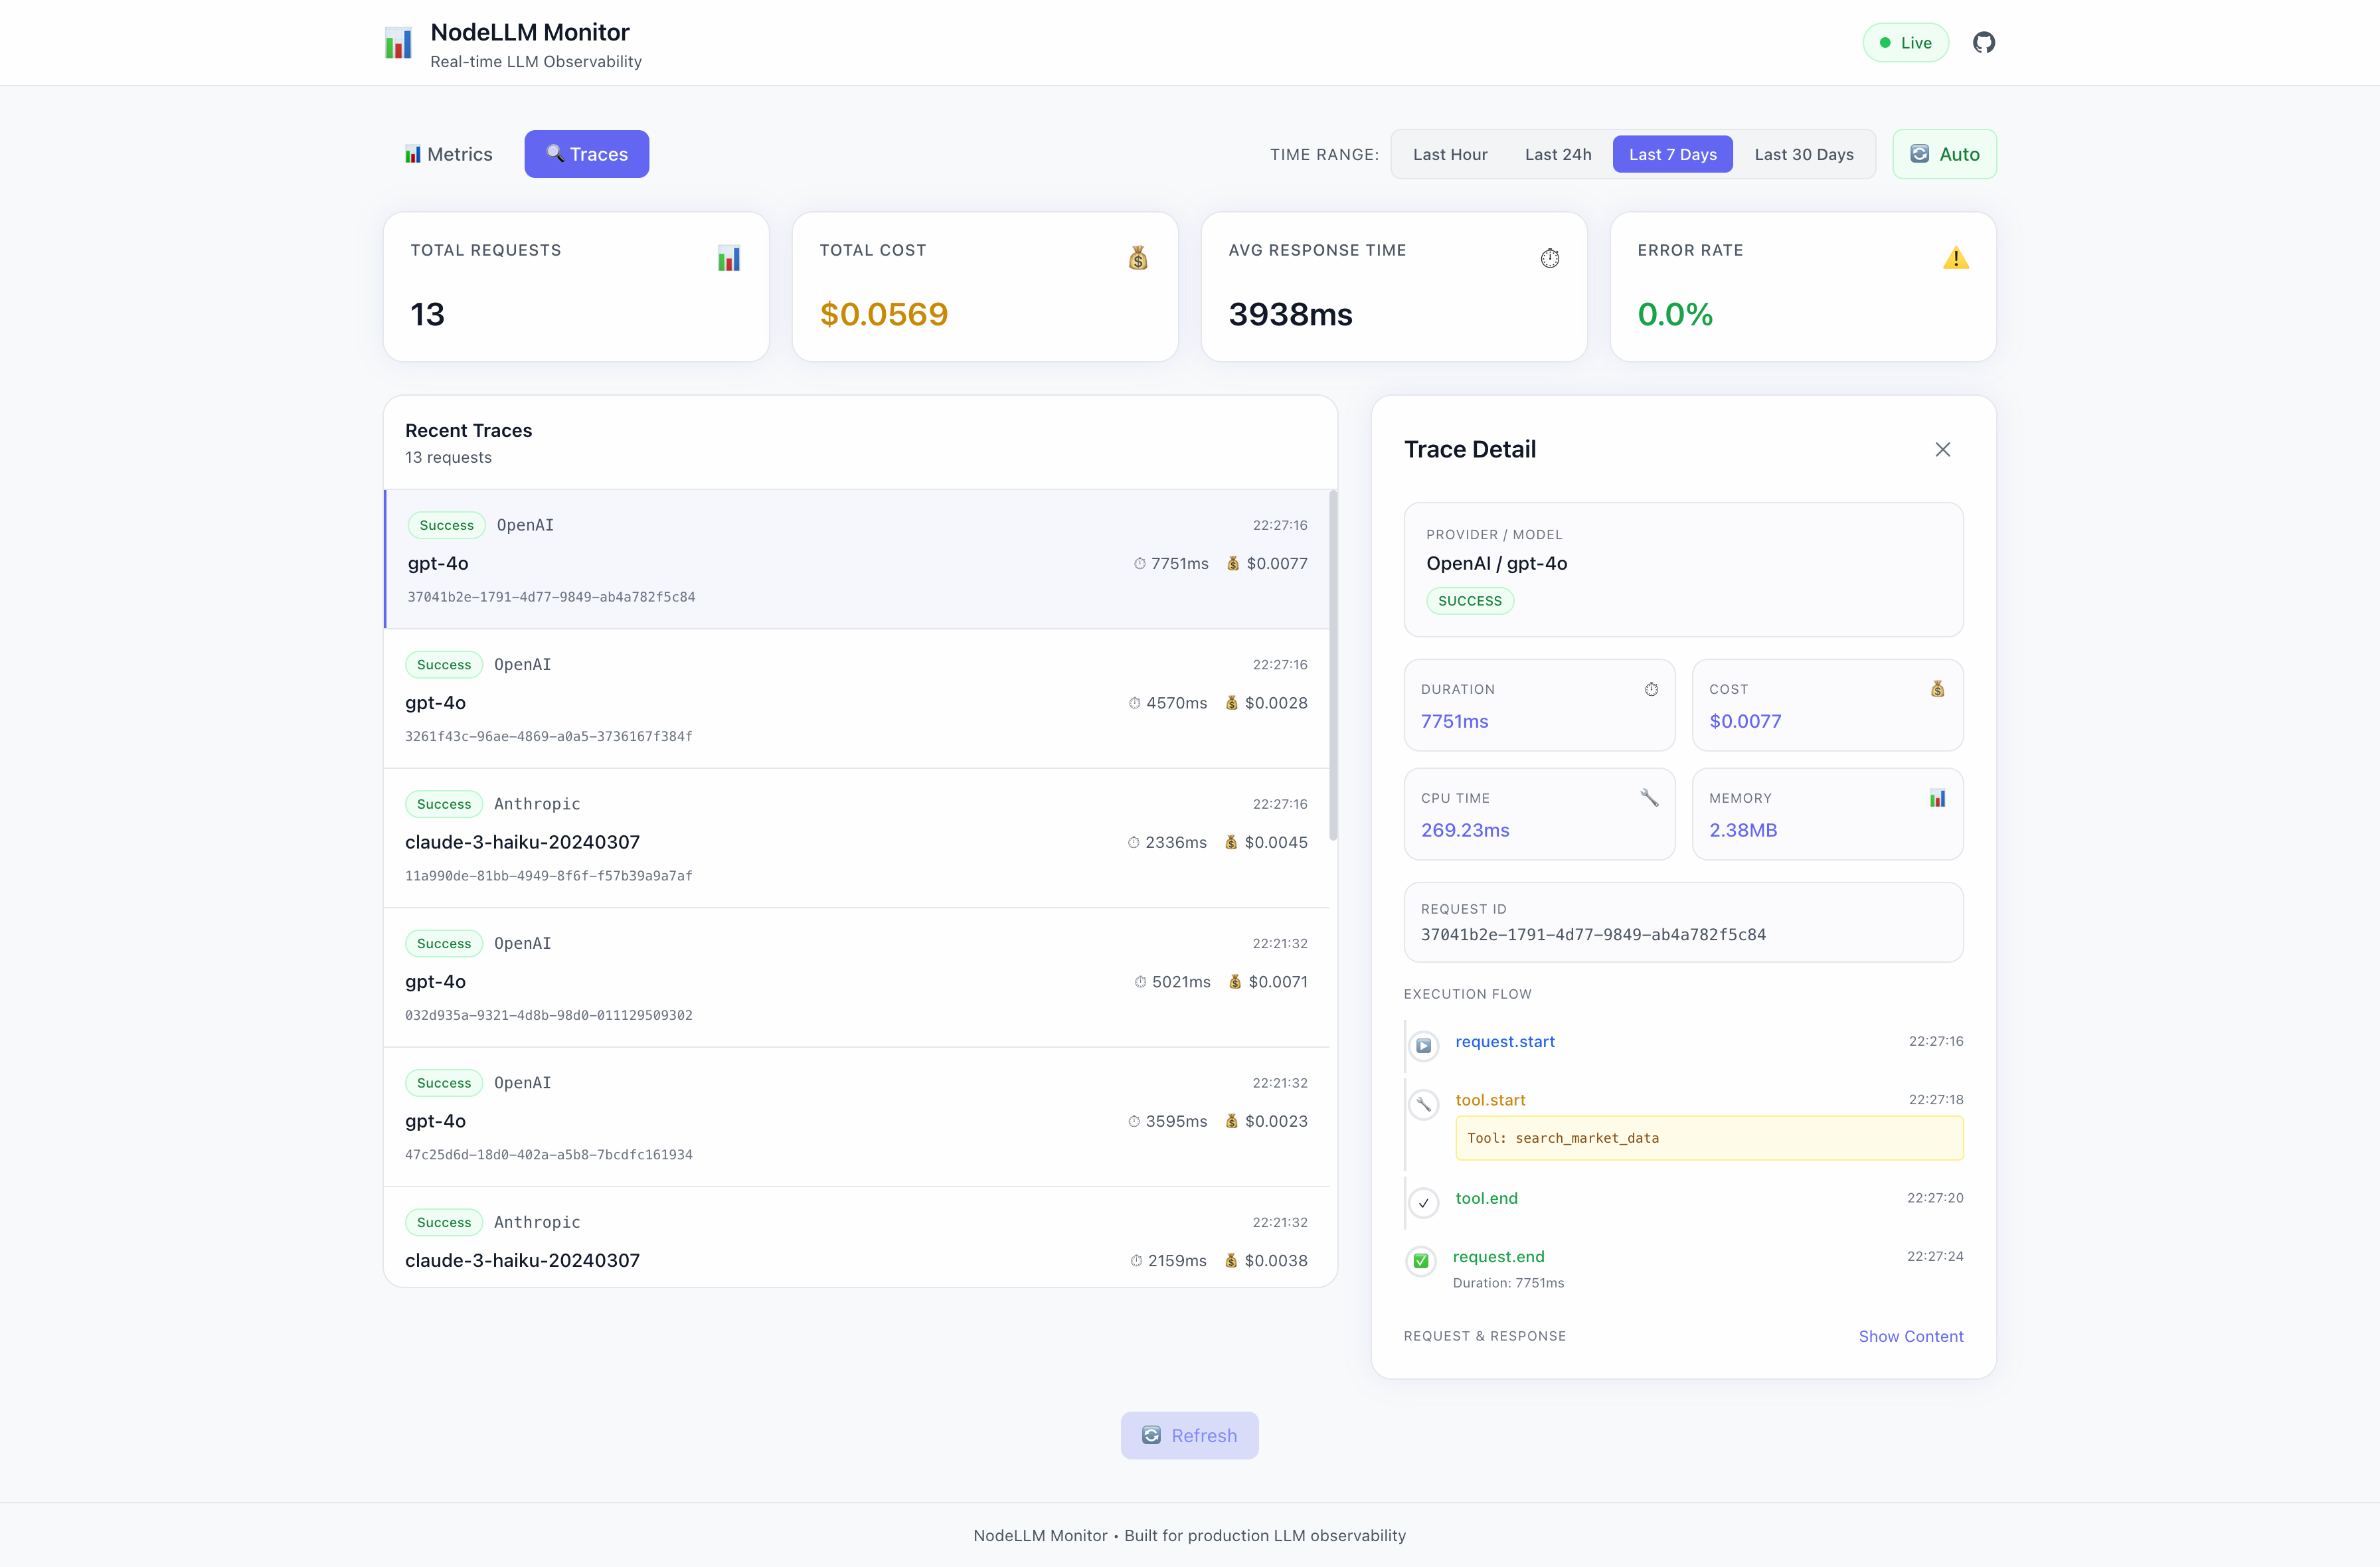
Drill into individual requests:
- Full execution timeline
- Tool call breakdown
- Request/response content
- Error details and stack traces
Token Analytics View
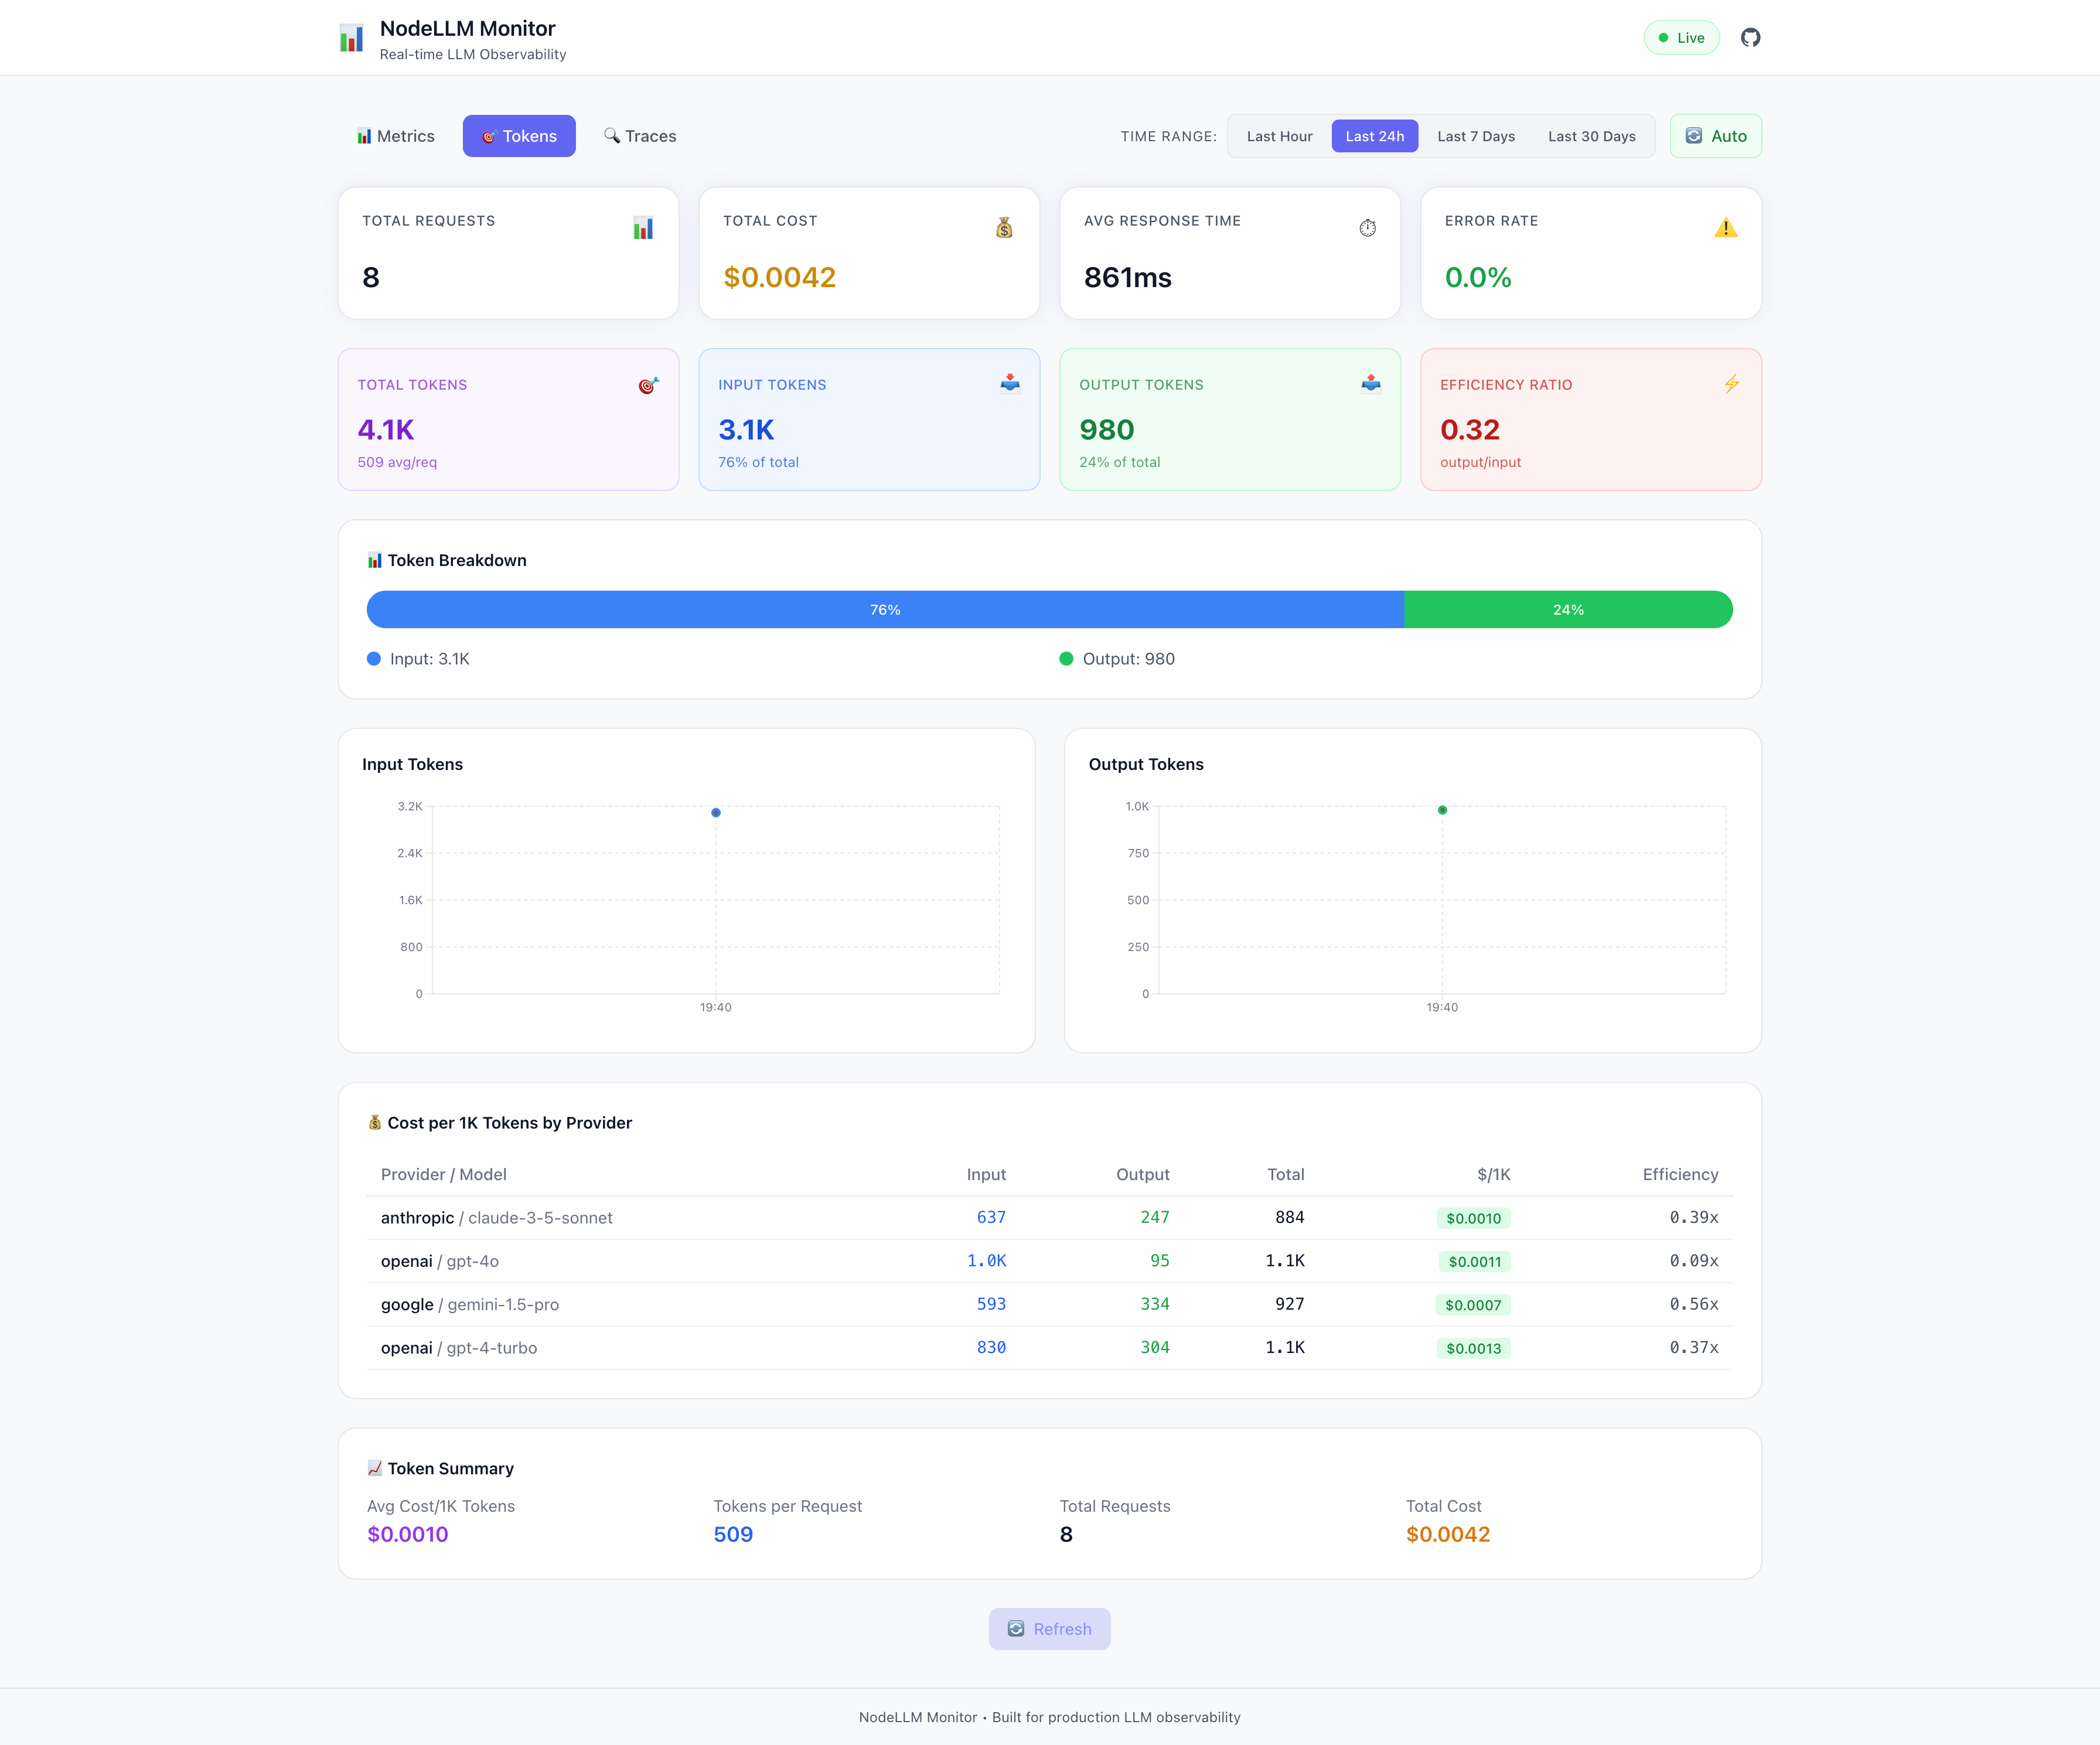
Deep dive into token usage:
- Total Tokens — Input vs output breakdown with efficiency ratio
- Token Breakdown — Visual input/output distribution bar
- Time Series Charts — Input and output tokens over time
- Cost per 1K Tokens — Per-provider/model cost analysis
- Token Summary — Avg cost, tokens per request, estimated spend
Perfect for optimizing prompts and identifying cost drivers.
Running the Dashboard
To launch the dashboard, you need to share the storage adapter between the Monitor and the Dashboard:
import { Monitor, MemoryAdapter } from "@node-llm/monitor";
import { MonitorDashboard } from "@node-llm/monitor/ui";
import { createServer } from "node:http";

// 1. Create a shared store
const store = new MemoryAdapter();

// 2. Connect the Monitor
const monitor = new Monitor({ store });

// 3. Connect the Dashboard
const dashboard = new MonitorDashboard(store, { basePath: "/monitor" });

// 4. Mount to a server
createServer((req, res) => dashboard.handleRequest(req, res)).listen(3001);
console.log("Dashboard at http://localhost:3001/monitor");
Storage Adapters
Choose the right storage for your use case:
Memory (Development)
import { Monitor } from "@node-llm/monitor";

const monitor = Monitor.memory();
Fast, ephemeral—perfect for development.
File (Logging)
import { createFileMonitor } from "@node-llm/monitor";

const monitor = createFileMonitor("./logs/llm-events.log");
Append-only JSON lines—great for debugging.
Prisma (Production)
import { PrismaClient } from "@prisma/client";
import { createPrismaMonitor } from "@node-llm/monitor";

const prisma = new PrismaClient();
const monitor = createPrismaMonitor(prisma);
Full SQL storage with querying, aggregation, and retention policies.
Privacy & Security
By default, content capture is disabled:
import { Monitor } from "@node-llm/monitor";

const monitor = Monitor.memory({
  captureContent: false, // Default: don't store prompts/responses
});
When you do need to capture content (for debugging), automatic scrubbing kicks in:
const monitor = Monitor.memory({
  captureContent: true,
  scrubbing: {
    pii: true,     // Scrub emails, phone numbers, SSNs
    secrets: true, // Scrub API keys, passwords, tokens
  },
});
PII is redacted before it ever hits storage.
Cost Attribution
Track costs by session or transaction:
const chat = llm.chat("gpt-4o");

// Use sessionId and transactionId to group related requests
const response = await chat.ask("Summarize this document", {
  sessionId: session.id,
  transactionId: `doc-search-${docId}`,
});
Then query costs from the store:
// Query with Prisma
const costBySession = await prisma.monitoring_events.groupBy({
  by: ["sessionId"],
  where: {
    eventType: "request.end",
    time: { gte: new Date("2026-01-01"), lte: new Date("2026-01-31") }
  },
  _sum: { cost: true },
});
Time Series Aggregation
Built-in aggregation for dashboards and alerts:
import { TimeSeriesBuilder } from "@node-llm/monitor";

// Create builder with 1-hour buckets
const builder = new TimeSeriesBuilder(60 * 60 * 1000);

// Build time series from events
const timeSeries = builder.build(events);
// Returns: { requests: [...], cost: [...], duration: [...], errors: [...] }

// Or use the store's built-in getMetrics
const metrics = await store.getMetrics({
  from: new Date(Date.now() - 24 * 60 * 60 * 1000),
});
Perfect for Grafana, Datadog, or custom dashboards.
Works Without NodeLLM
While optimized for NodeLLM, the monitor works with any LLM library:
import { Monitor } from "@node-llm/monitor";

const monitor = Monitor.memory();

const ctx = {
  requestId: crypto.randomUUID(),
  provider: "openai",
  model: "gpt-4",
  state: {},
};

await monitor.onRequest(ctx);

try {
  const startTime = Date.now();
  const response = await openai.chat.completions.create({ ... });
  await monitor.onResponse(ctx, {
    toString: () => response.choices[0].message.content,
    usage: response.usage,
  });
} catch (error) {
  await monitor.onError(ctx, error);
}
Use it with Vercel AI SDK, LangChain, or raw OpenAI.
Installation
npm install @node-llm/monitor
With OpenTelemetry (Vercel AI SDK, etc.):
npm install @node-llm/monitor @node-llm/monitor-otel
With Prisma (production):
npm install @node-llm/monitor @prisma/client prisma
Add the schema and run migrations—see the Prisma setup guide.
OpenTelemetry Integration
NEW in v0.3.0: Zero-code instrumentation for Vercel AI SDK and other OTel-instrumented libraries via @node-llm/monitor-otel.
npm install @node-llm/monitor-otel @opentelemetry/sdk-trace-node
import { NodeTracerProvider } from "@opentelemetry/sdk-trace-node";
import { NodeLLMSpanProcessor } from "@node-llm/monitor-otel";
import { Monitor } from "@node-llm/monitor";

const monitor = Monitor.memory();
const provider = new NodeTracerProvider();

// Hook the AI-aware SpanProcessor into your OTel pipeline
provider.addSpanProcessor(new NodeLLMSpanProcessor(monitor.getStore()));
provider.register();

// Now Vercel AI SDK's experimental_telemetry flows to node-llm-monitor
await generateText({
  model: openai("gpt-4o"),
  prompt: "Hello",
  experimental_telemetry: { isEnabled: true }
});
The processor automatically extracts:
- Provider and model names (normalized from OTel attributes)
- Token counts and cost estimation
- Streaming metrics (ms to first chunk, tokens/sec)
- Tool call details
- Full request/response content (when enabled)
What's Next
This is just the beginning. Coming soon:
- Alerting — Get notified when costs exceed thresholds
- Anomaly Detection — Automatic detection of unusual patterns
- Multi-Tenant — Isolated monitoring per customer
Get Started
npm install @node-llm/monitor
Documentation: nodellm.dev/monitor
GitHub: github.com/node-llm/node-llm-monitor
Stop guessing. Start monitoring.